It is surprising how often these "simple" things come up.
"What is the difference between a metric and a key performance indicator (KPI)?"
"What is a dimension in analytics?"
"What is segmentation?"
"Are goals metrics?"
And many more.
There seems to be genuine confusion about the simplest, most foundational, parts of web metrics / analytics. So in this short post let's try and see if we can fix this really basic problem.
Definitions and standard perspectives on these terms will be covered in this post:
- Business Objectives
- Goals
- Metrics
- Key Performance Indicators
- Targets
- Dimensions
- Segments
A standard definition will be provided, but more than that my hope is to solidify your understanding with concrete examples and pictures.
The post will end with a "Web Analytics Measurement Framework" – a very lofty name for something that will help you put your understanding of this post into practice.
Business Objectives:
This is the answer to the question: "Why does your website exist?"
Or: "What are you hoping to accomplish for your business by being on the web?"
Or: "What are the three most important priorities for your site?"
Or other questions like that.
Without a clearly defined list of business objectives you are doomed, because if you don't know where you are going then any road will take you there.
The objectives must be DUMB: Doable. Understandable. Manageable. Beneficial.
 90% of the failures in web analytics, the reasons companies are data rich and information poor, is because they don't have DUMB objectives.
Or they have just one (DUMB) Macro Conversion defined and completely ignore the Micro Conversions and Economic Value.
Your company leadership (small business or fortune 100) will help you identify business objectives for your online existence. Beg, threaten, embarrass, sleep with someone, do what you have to get them defined.
Point of confusion: People, like me, often also use the term Desirable Outcomes to refer to business objectives. They are one and the same thing.
[Full disclosure: Depending on the specificity of your business objectives my asking you for your "desirable outcomes" could refer to "what are your goals". See below...]
Goals:
Goals are specific strategies you'll leverage to accomplish your business objectives.
Business objectives can be quite strategic and high level. Sell more stuff. Create happy customers. Improve marketing effectiveness.
Goals are the next level drill down.
It goes something like this. . .
Sell more stuff really means we have to:
1. do x
2. improve y
3. reduce z
Improve marketing effectiveness might translate into these goals because currently they are our priorities:
1. identify broken things in m
2. figure out how to do n
3. experiment with p type of campaigns
Get it?
The beauty of goals is that they reflect specific strategies. They are really DUMB. They are priorities. They are actually things almost everyone in the company will understand as soon as you say them.
I would not have included the step of identifying Goals were it not for the fact that almost every C level executive, every VP and SVP, give very high level nearly impossible to pin down business objectives.
Point of confusion: Many web analytics tools, like Google Analytics, have a feature that encourages you to measure Goals. Like so. . .
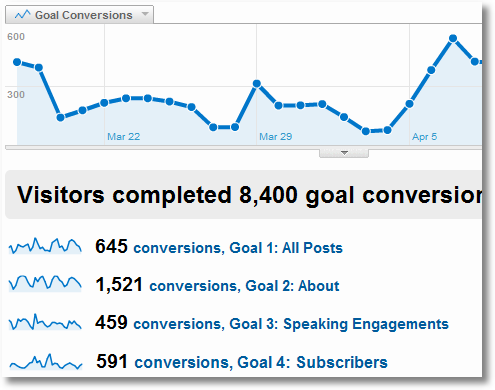
It is possible that some Analytics Tool Goals directly measure your business objectives or goals. Usually though Analytics Tool Goals do not rise to the strategic importance so as to measure either your business objectives or your goals.
For example only one of the above, Subscribers, is an actual goal ("increase persistent reach")for me that lines up directly with a business objective ("effective permission marketing"). Others are nice to know.
So to be clear: Just because you have Goals in your analytics tool defined is not a sure sign that you know what your business objectives or goals are.
Before you touch the data make sure your business objectives (usually 3, or 5 max) are clearly identified and you have drilled down to really DUMB goals!
Metric:
A metric is a number.
That is the simplest way to think about it.
Technically a metric can be a Count (a total) or a Ratio (a division of one number by another).
Examples of metrics that are a Count is Visits or Pageviews.
Examples of a Ratio is Conversion Rate (a quantitative metric) or Task Completion Rate (a qualitative metric).
This is a crude way to think about it but. . . Metrics almost always appear in columns in a report / excel spreadsheet.
This is what metrics look like in your web analytics tool:

Metrics form the life blood of all the measurement we do. They are the reason we call the web the most accountable channel on the planet.
Key performance indicators (KPI's) are metrics. But not normal metrics. They are our BFF's.
Here is the definition of a KPI that is on Page 37 of Web Analytics 2.0:
A key performance indicator (KPI) is a metric that helps you understand how you are doing against your objectives.
That last word – objectives – is critical to something being called a KPI, which is also why KPI's tend to be unique to each company.
I run www.bestbuy.com. My business objective is to sell lots of stuff. My web analytics KPI is: Average Order Size.
Business objective: Sell Stuff. KPI: Average Order Size.
I might use other metrics in my reports, say Visits or # of Videos Watched or whatever. But they won't be my KPI's.
Makes sense? No? Ok one more. . .
I run www.nytimes.com. My business objective is to make money. One of my KPI's is: Visitor Loyalty (number of visits to the site by the same person in a month) and another one is # of clicks on banner ads.
So one thing should be pretty clear to you by now. . . if you don't have business objectives (from your HiPPO's) clearly defined, you can't identify what your KPI's are.
No matter how metrics rich you are. You'll be information poor. Forever. So. Don't be.
Business Objectives -> Goals -> KPI's -> Metrics -> Magic.
Targets:
Targets are numerical values you have pre-determined as indicators success or failure.
It is rare, even with the best intentions, that you'll create targets for all the metrics you'll report on.
Yet it is critical that you create targets for each web analytics key performance indicator.
I am still at Best Buy. My KPI is still Average Order Value. But how do I know what's good or bad?
I'll consult with my finance team. I'll confab with my Assistant Senior Vice President for American Online Sales. I'll look over my historical performance.
Through this consultative process we'll create a 2010 AOV target of $95.
Now when I do analysis of my performance (not just in aggregated but segmented by geo and campaign and source and…) I'll know if our results are good or bad or ugly.
I will do this for every single KPI whose responsibility is thrust on em.
You can create targets for the quarter (Christmas!) or for the year or to any drill down level of specificity. But at least have one overall target for each KPI.
Business Objectives -> Goals -> KPIs -> Metrics -> Targets -> Minor Orgasms.
Dimension:
A dimension is, typically, an attribute of the Visitor to your website.
Here's a simplistic pictorial representation. . .
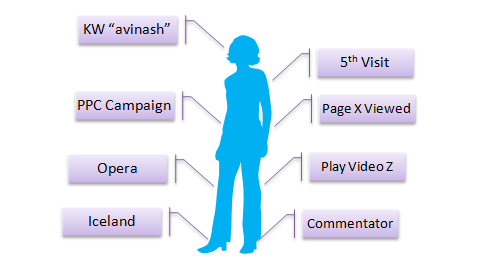
The source that someone came from (referring urls, campaigns, countries etc) is a dimension in your web analytics data.
So is technical information like browsers or mobile phones or (god save you if you are still doing daily reports on) screen resolution or ISP used.
The activity a person performed such as the landing page name, the subsequent pages they saw, videos they played, searches they did on your website and the products they purchased are all dimensions.
Finally the day they visited, the days since their last visit (if returning visitor) the number of visits they made, the number of pages they saw are all dimensions as well. I know, I know, they sound like metrics. But they are, as the definition says up top, attributes of the visitor and their activity on your website.
This is a crude way to think about it but… Dimensions almost always appear in rows in a report / excel spreadsheet.
Here are the metrics and dimensions in one of my favorite Yahoo! Web Analytics reports, it shows me how many clicks it takes for visitors to get to content I consider valuable. . .
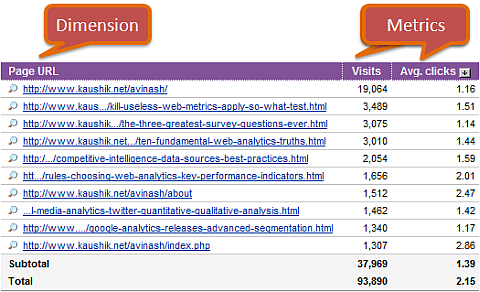
Columns and rows. Get it?
Let's solidify this with another example of a report that shows metrics and dimensions. This report might not come to your mind most easily. I am looking at the internal site searches (on this blog) and the continent from where the search is done and a set of metrics to judge performance. . .
Dimensions allow you to group your data into different buckets and they are most frequently used to slice and dice the web analytics data.
In your web analytics tools you'll bump into dimensions when you are either creating custom reports (love this!) or doing advanced segmentation (worship this!). The chooser thingys look like this. . .
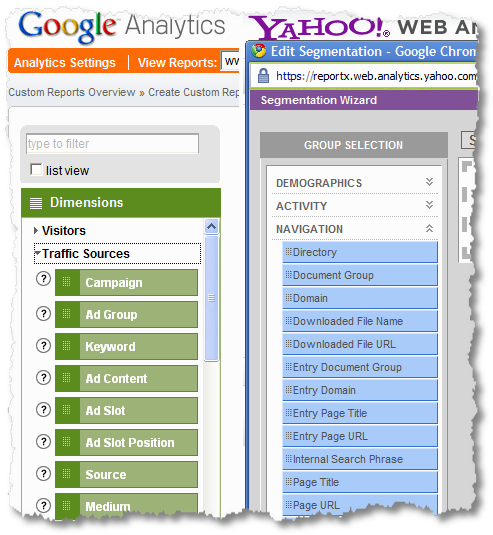
In Yahoo! Web Analytics they are called "Groups" or "Group Selection" but they are the same thing: Dimensions.
There are many long and complicated definitions of dimensions. There are some nuances that I have simplified. But I hope that this definition and explanation helps you internalize this key concept in web analytics.
A segment contains a group of rows from one or more dimensions.
In aggregate almost all data is useless (like # of Visits). The best way to find insights is to segment the data using one or more dimensions (like # of Visits from: USA, UK, India as a % of All Visits).
You segment by dimensions and report by metrics.
Here are some examples of segments I use in my Google Analytics account:
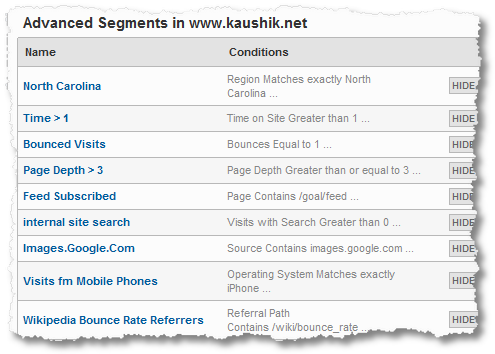
Checkout the dimensions I am using to segment my website traffic to understand performance better.
- Analyzing people just from North Carolina (because there was an ad campaign targeted just to NC)
- People who spend more than one minute on the site
- People who click on the link to go to Feedburner to sign up for my RSS feed
- People who come from images.google.com and smart mobile phones
- People who visit from one source, Wikipedia, AND only one page on Wikipedia (the bounce rate article)
These are just a few of the 28 advanced segments I have created in my analytics profile.
And I am not even a real business.
Think of how many segments I would analyze to truly analyze my Key Performance Indicators to understand causes of success or failure of my Business Objectives!
The Analysis Ninja rallying cry: Segment or Die!
: )
So now you know the seven most fundamental, yet critical, things you need to know about online analytics.
If you fee that you did not understand it all, please go back and re-read it. You are very welcome to ask questions or for clarification via comments. Whatever it takes, make sure you are able to internalize this.
Let's move to the last step. . .
Web Analytics Measurement Framework
As promised I want to wrap up this post with a couple of examples that pull this whole thing together.
Let's say I am responsible for the National Council of La Raza (a wonderful organization I support). Here is how the measurement framework could possibly look for me. . .
Business Objective:
Attendance at immigration rallies.
Goals:
Increase web sign ups.
Key Performance Indicators:
# of NCLR Sign-ups for NCLR Action Alerts
# of Individual Memberships
Target:
Action Alert: 14,000 per month
Memberships: 4,800 per month
Segments:
Acquisition: Organic search, Email campaigns, Mid-western US states
Behavior: Visits to conversions (Action Alerts, Memberships)
All this before I cracked open any web analytics tool.
I have a framework I can use to ensure that the work I do is focused on what's important to the organization, what good or bad looks like in terms of performance and finally I have a segmentation plan ready to do the preliminary analysis of the data.
No fishing expeditions. No data puking. No begging people to pay attention to data!
One more example.
If you are a student in the MarketMotive Master Certification course as a part of your final dissertation you have to submit complete analysis of two websites. One eCommerce and one non-eCommerce. You are supposed to start from scratch, do all of the above and present actionable recommendations. The path you follow, the quality of your analysis and your insights determine if you are awarded the certification, or not.
One of the web analytics students in the just concluded course was Matt Smedley.
In his dissertation Matt used the above framework very effectively to focus and structure his analysis.
Here is Matt's actual picture from his dissertation that tells the whole story:
[Click on the image for a higher resolution version.]
I really liked Matt's presentation for his motor bike company analysis. In less than half a page one could see the complete picture of what the business was solving for and what the expectations were.
Particularly clever I thought was his inclusion of the segmentation in his framework presentation. At a glance for the most important goal for the quarter (build a robust customer database for future marketing) you can see how their campaign strategy worked.
Don't even get me started on how awesome it was for him to including Profit as a KPI. Truly heart warming.
I hope you will find inspiration from Matt's presentation to go create a version of this framework for your company.
We worry so much about tags and data collection and Omniture vs. WebTrends. What we should actually worry about is above. It is not easy to arrive at, but without it all you have is unlimited potential for failure.
And I know that is not going to happen to you.
I wish you all the very best.
Ok now your turn.
